
The CO2 Matrix on the East Coast of the United States
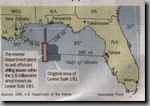
In the early 1990's, oil companies began to bring on-line monster oil-wells
in the Gulf of Mexico (GOM).

Whereas the average US oil well produced seven barrels a day, Monster GOMs
daily produced 30,000 to 50,000 barrels.
Only a few wells, around 50, produce a quarter of the US gas and oil.
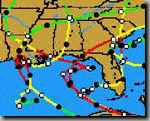
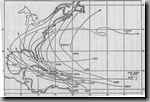
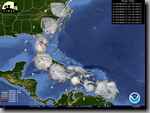
If these monster wells were to cause downwind droughts, the "horseshoing"
path of hurricanes in the Gulf shows where the drought should be as the GOM
wells became active.
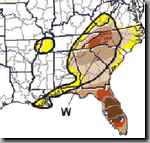
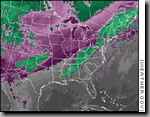
This East Coast drought map captures the impact of upwind oil fields in the
Gulf. But the drought went away even though the wells are still there. Why?
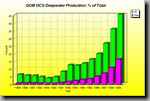
The East Coast drought went away when a distribution system for the natural
gas was completed so that all the gas was not flared off into the atmosphere
as CO2.
The Gulf of Mexico as home to both hurricanes
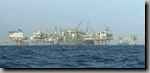
and oil rigs provides a unique laboratory for exploring and futher proving
the CO2 Matrix.
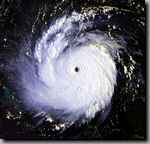
The first hurricane of 1992 was a near-perfect donut, Andrew.
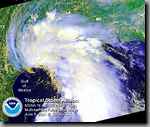
Allison, the first hurricane of 2001, has become invisible in the lower left
even though hurricane winds were present.
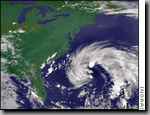
A year after Allison, 2002, Gustav looks like Pacman.
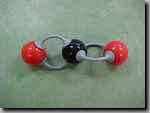
The CO2 matrix can be seen in evolving shapes and behavior of hurricanes,
2004 Charley. What is changing the images of hurricanes? The CO2 matrix.
"Hurricanes for Dummies" explains this.
Next time we will review the timeline of oil in Texas and show why the 1930's
Dustbowl was not caused by farmers but by oilmen.