


Graphs of CO2
| CO2 Emissions
|
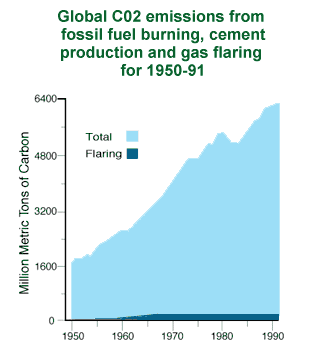
| CO2 Emissions 1950-1990
|
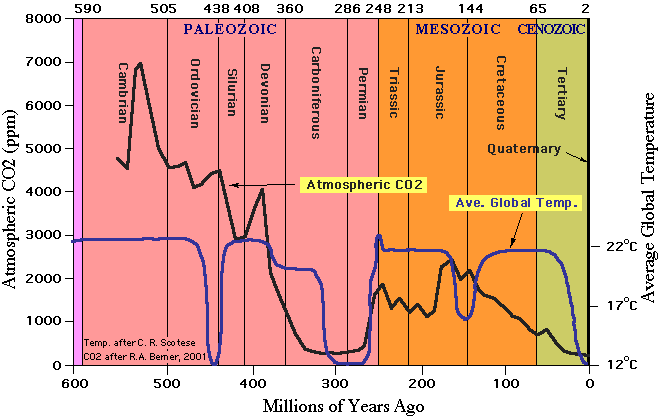
| 600million years
|
| 600 million years
|
|
|
| Link Label on this page | Uploaded | Webpage Title of Link file | |
| (A) No Incomplete Links: | |||
| (B) No HTTP:// Links: | |||
| (C) No Dated Links: Annotated References: HTB | |||
| (D) No Templates: | |||
| (E) No Internal Links, Absolute (non-dated): | |||
| (F) Internal Links, Relative (non-dated and ignore lifehour credit links): | |||
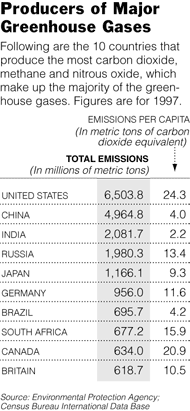
| > | #1 CO2graph.gif | auto | Non-HTM file |
| > | #2 CO2levels600MilYears-JunkScienceCom.gif | auto | Non-HTM file |
| > | #3 CO2emis.jpg | auto | Non-HTM file |
| (G) Current Directory Links | |||
| > | #1 co2.jpg | auto | NO TITLE |
'Links From' Pages linking to this page: ( )No IndexDir ... Refs General ... !RefsRvu ... !Dir.nts) InfoLinks (05-22-2015@07:28) Linkstat:LinksFrom2Table
| Link In From | Uploaded | Webpage Title of Link In file | |
| < | #1 FalseHopes | 100305 | False Hopes: Falsehoods Fostered by Fools Full of Fuelish Facades and Facetious Flatulence! |
| < | #2 IndexToEssays | 071101 | Index to Global Dying Essays (manual) |